Solution overview
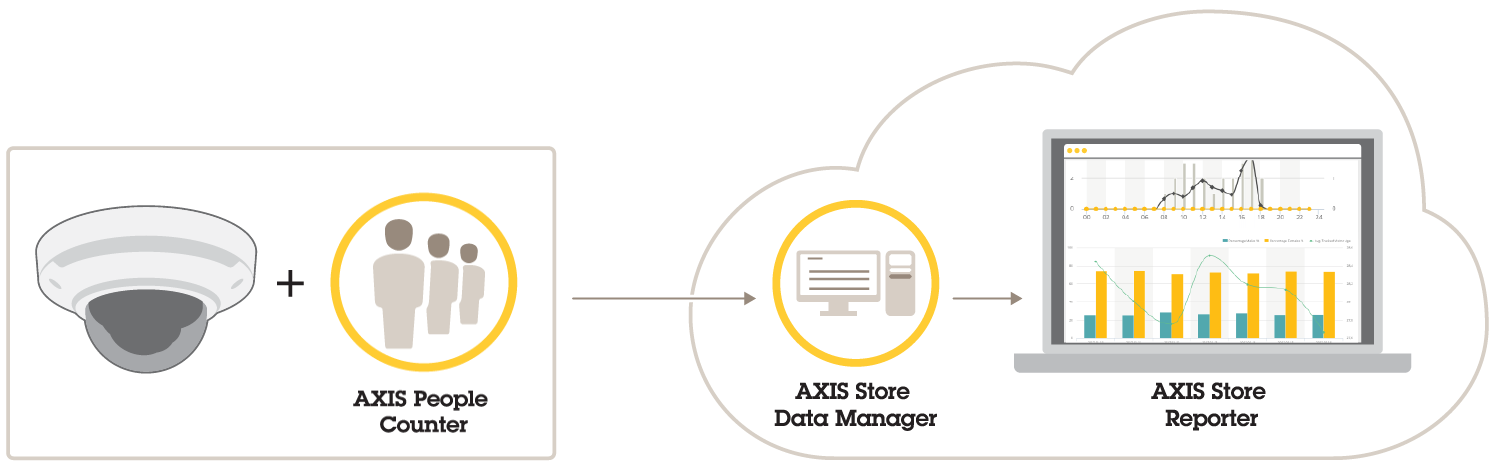
The solution consists of several parts:
The analytics application on the edge device registers counting data and sends it to AXIS Store Data Manager.
AXIS Store Data Manager, a cloud component, stores and arranges the statistical data.
AXIS Store Reporter, a hosted server side tool, presents the statistical data in graphs and tables.
AXIS License Manager, an online tool, monitors and manages all your annual subscription licenses. For more information, see the user manual for AXIS License Manager.
About POS integration
It’s possible to integrate point of sales (POS) in AXIS Store Reporter, but the solution is sold separately through professional services. For more information, contact your local Axis sales office.
Get started
To get started with AXIS Store Reporter, you need to:
Create a company in AXIS Store Data Manager
To create a new end-user company in AXIS Store Data Manager:
Go to asdm.axis.com
Use your My Axis username and password to sign in.
If you don’t have an account yet, go to my.axis.com to create one.
Create a company and an instance for the company.
It takes a few minutes for the instance to be created.
License AXIS Store Reporter
You can license AXIS Store Reporter 24 hours after you created the instance for your company in AXIS Store Data Manager.
To license AXIS Store Reporter, follow the instructions in AXIS License Manager user manual. For information about how to manage your organization, see My Systems user manual.
Connect cameras to AXIS Store Data Manager
Go to asdm.axis.com and sign in with your My Axis username and password.
Select company.
In the camera’s webpage, Connect cameras to folders.
Create stores, add the cameras to the stores, and add details for each store.
Why do I need to create folders?
Create folders according to your company structure. It’s helpful to sort the cameras in a structured way to keep track of them when doing maintenance or troubleshooting. The folder setup does not affect how the statistics show up in AXIS Store Reporter.
- Recommendations
Create one folder per store. You can also have one folder per country or region.
Create the folder structure based on the company’s organizational or geographical setup.
Name the folders and the cameras according to the naming conventions used in your organization.
Example
Let’s say you have six stores in three different countries. Here’s an example how to set up your folders.
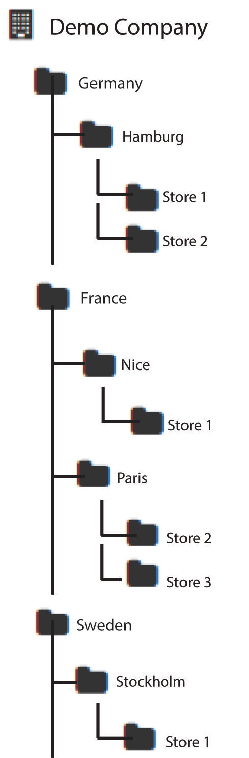
Create folders
In AXIS Store Data Manager, go to Sources.
Set up a folder structure for your company.
Enter names for the folders and the cameras.
Set the folder connection details
- The folder connection identifier and password are used to authenticate the camera to send the statistical data to the corresponding folder.
- We recommend that you set the identifier and the password to something that corresponds to the store.
In AXIS Store Data Manager, go to Sources.
Select the folder in the list.
Click Edit folder connection settings.
Select Enable connections to this folder.
Enter a name in the Folder connection identifier field.
Enter a password in the Folder connection password field and confirm the password.
Get notified about communication problems
You can get an email warning if a camera stops reporting to the application, which is often caused by network connection problems, or if the camera stops sending data to the server.
Hours without count data allowed: Enter the number of hours allowed to pass without any data sent from the camera.
Remember that the Hours without count data allowed should be set at least as long as your longest closing time.
Hours without communication allowed: Enter the number of hours allowed to pass without communication.
Email for warnings: If you want warnings sent as emails, type the address.
If you don’t type an email address, you get the warning as a notification on the AXIS Data Manager webpage.
Click Submit.
Connect cameras to folders
To perform this task, the application must be installed on the camera.
In AXIS Store Data Manager, go to Sources and get the Folder connection identifier and the Folder connection password for the folder you want to connect to.
In the camera's web interface, go to Settings > Apps and open the application’s web interface.
Enter the web address for AXIS Store Data Manager, for example
https://[subdomain].asdm.axis.com/datamanagerwhere[subdomain]is replaced by a unique name.- Note
Check if the outbound traffic on your internal network is restricted. Outbound communication should be allowed on the ports 80 and 443 for AXIS People Counter and 443 for AXIS P8815-2 3D Counter
Why do I need to set up stores?
To be able to show, categorize and make drill downs in the statistical data in AXIS Store Reporter, add the cameras to stores. Stores are the base for how the statistical data shows up in AXIS Store Reporter.
What is a store?
A store contains a certain amount of cameras, called sources. For each store you can add metadata like department, sales area, location and get weather data based on the location.
Create stores
Go to Sets.
Click Add store.
Type a Name for the store.
Under Store details, optionally enter Sales area, Location, and Day start hour.
Under Store content, add the cameras located in this store in the Store cameras field.
Optionally create departments in the store by clicking Add department.
Type a name in the Department name field.
Add the cameras located in this department in the Department cameras field.
- Note
Cameras added in Department cameras are only counted on the department level as default and not added to the store. If you want the department cameras to belong to the store, select Camera is on store perimeter.
Click Save store.
Connect AXIS Store Data Manager to AXIS Store Reporter
AXIS Store Reporter fetches data from AXIS Store Data Manager. When the cameras are added to AXIS Store Data Manager and data fetching has been enabled, they automatically appear in AXIS Store Reporter. It may take up to several hours for all the data to be fetched, depending on how much data is available.
You can also fetch the data through permanent links, see the section about exporting data in the manual for AXIS Store Data Manager.
Push data to AXIS Store Reporter
Go to Sets > Stores.
To push data for all cameras included in the store, click
 .
.The icon turns green when the connection is working.
Access AXIS Store Reporter
Each time you create a new company under AXIS Store Reporter, an invitation is sent to the email address that was used to create the account and URL. You can use this account to invite other users to AXIS Store Reporter.
The standard web address to AXIS Store Reporter is asr.axis.com
- Any of the following accounts can log in to this site:
The account used when you created the AXIS Store Data Manager instance. It could be the system integrator or the end user.
Any account that was sent an invitation from AXIS Store Reporter by the system integrator or the end user.
Any account with administrator rights to AXIS Store Reporter.
Log in to AXIS Store Reporter with the username and password that you got from the system integrator or the end user.
The dashboard in AXIS Store Reporter
The dashboard shows your frequently viewed metrics and charts. To change the dashboard appearance, use the filters. See Filter the dashboard and the reports.
You can also change the default dashboard, the metrics and the filter groups, see Company settings. In the company settings, you can also configure business hours, to show statistics only for certain hours of the day.
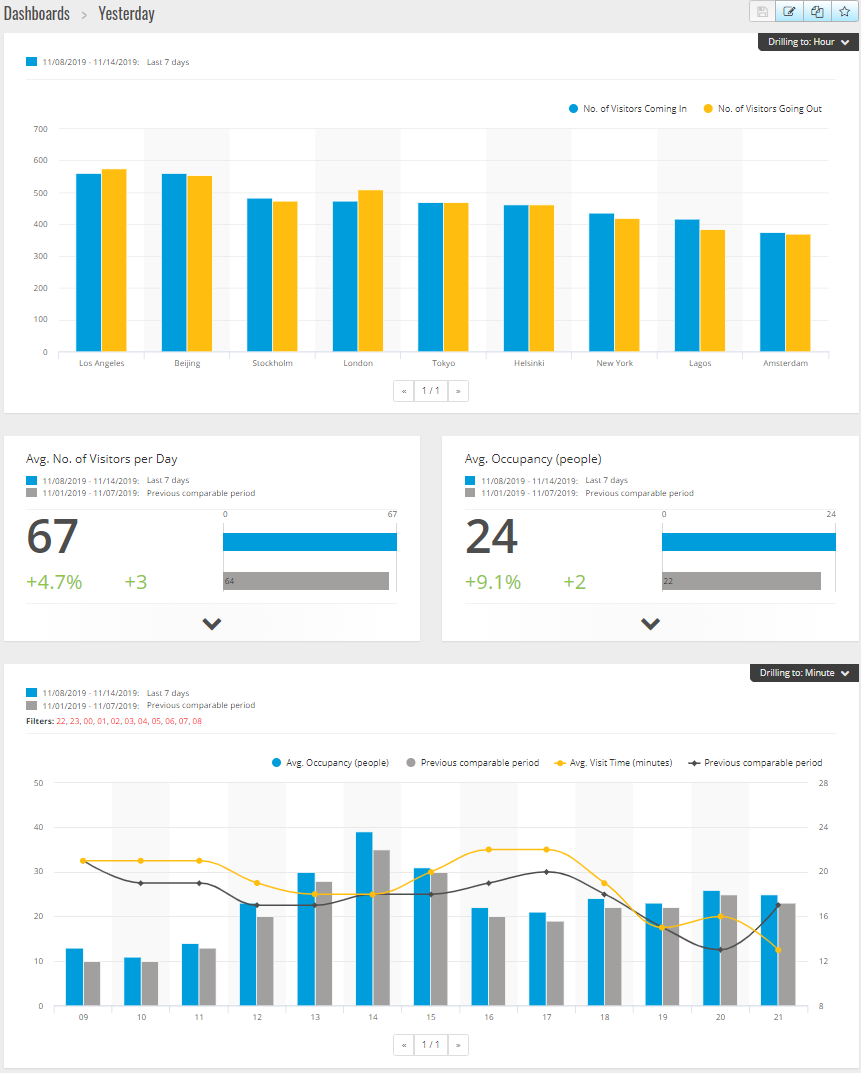
Dashboard elements
- Time
- The time section show what time interval that is used for the metrics and charts. The blue color shows the selected period and the grey color shows the comparison period.
- Metric modules
- The metric modules are used to show key figures and summarized statistical data. You can always click on the arrow to expand the module and get more details.
- Chart modules
- The chart modules gives an overview of statistical data. Hover the mouse over the bars or click on the bars to get a new graph with more details.
- View report
- Click View report to go to the analytics page for the specific module.
- Export as PDF
- To save the current dashboard as a PDF file, click Export as PDF.
Filter the dashboard and the reports
The filter controls what to display both on the dashboard and on the analytic reports.
Go to Dashboard.
Click Show filters.
If this is the first time you use the application, take the tour to guide you through the filters.
To change the time interval, select Time.
To change the comparison period, select Compare to.
Add, hide or remove Metrics and Charts in the dashboard.
To rearrange the order of the elements in the dashboard, drag and drop the elements in the filter view.
Select which area and store you want to show. To ignore the element, add it to the minus list. To see the element, add it to the plus list.
If you want to access the filter later, click Save.
Click Refresh.
Create a custom dashboard
Create custom dashboards with the metrics and charts that are the most relevant to you.
Click the drop-down arrow next to Dashboard.
Click New Dashboard.
Enter a title and an optional description.
Select one of the following dashboard types:
User dashboard: only visible for the user.
Company dashboard: shared with other users in the company. If you select this option, you can choose if you want the whole company to access the dashboard or restrict the access to certain teams or users.
In the Filters section, select filter. To understand how the filters work, go to Filter the dashboard and the reports.
In Layout, click +.
Enter an optional name for the component you want to add.
In the Component type section, select what component type you want to use, for example a chart.
For some of the component types, you can choose if you want the component to take up half the dashboard width or the full dashboard width.
In the Configuration section, design your chart. You can, for example, add and remove metrics, group the data, and add a secondary metric.
Click Save.
To add more components to your dashboard, click +.
When you’re done adding components to your dashboard, click Save.
Make sure you get the information you expect in your new dashboard.
Report templates
On the analytics page there are report templates that you can change and save as your own reports for quick access.
Different templates show up depending on your connected cameras. For example, if you have a people counter application in any of the connected cameras, you will see the templates for traffic reports and if you have the occupancy application in any of the connected cameras, you will see the occupancy templates.
Create a report using a template
Go to Analytics.
Select a template.
Use the filters to adjust the graph.
To save the report, click Save.
If you want the report to be visible for everyone in the company, select Shared (company report).
If you want the report to be valid for the whole company, but only show the data for the store that is set as default for a user, select Limit results by users default parameters.
- To find your saved reports, go to Analytics.
Create an email report
Go to Company settings > Analytics post definitions.
Create a new analytics post definition.
To select what data should be present in the email report on a global level, use the Global filters.
To limit the selection to only show data for the user’s default store in the email, click the checkbox under Global filters.
To add sections that should show up in the email report, click Add section.
If needed, edit the filter for each section. If you don’t set an individual filter, the global filter is applied.
Unsubscribe to reports
To get a list of all of your current subscriptions, go to Company settings > Analytics post subscriptions.
Click Unsubscribe.
User types
There are three types of users in AXIS Store Reporter:
- Administrator
- An administrator can, for example, access the company settings and manage the user accounts.
- User
- A user can log in to the application, but has fewer rights than an administrator account.
- An email user can only receive reports via email and not log in to the application.
How to create a user
Go to Company settings > Users > Invite user.
Enter the user email. Once invited, the email address is the username when the user logs in AXIS Store Reporter.
Select a predefined role for the user.
Select language.
Select which data the user has access to. Users can also inherit data access from the team they belong to.
Select the default dashboard that shows up when the user logs in to AXIS Store Reporter.
To limit the visibility to a certain store in reports, set the default parameter for this user. If you leave this empty, the default view for reports is all company stores.
The user can still view other stores, it’s just not the default view in reports.
To send reports to the user, set analytics post subscriptions.
Click Invite.
Company settings
The company settings can only be accessed if you are logged in with an administrator account.
Go to Company settings > Settings.
- General settings
- Change general settings, for example company default language and time zone.
- Business hours
- Configure business hours, for the whole company or for each store, to show statistics based only on those hours. Business hours for individual stores override business hours for the whole company. If you add a start date but no end date, the schedule never expires.
- Dashboard defaults
- Select the default dashboard for new users.
- Analytics defaults
- Select the default settings for analytics reports.
- Time periods
- Change the order of time periods as they appear in menus.
- Comparisons
- Change the order of comparison periods as they appear in menus.
- Metrics configuration
- Change the text on the buttons and manage language strings.
- Grouping configuration
- Change the names of the group labels.
- Filter configuration
- Change the names of the filters.
- Available reports
- Select what reports to show in the analytics section.
- Available dashboards
- Select what system dashboards to show in the dashboards menu.