Solution overview

AXIS Queue Monitor
AXIS Queue Monitor is an analytic application that can be installed on a network camera. The application monitors the number of people waiting in line.
AXIS Queue Monitor is intended for retail and other environments where you want to detect the number of people in a queue or monitor the intensity of movement in an area for further analysis or actions.
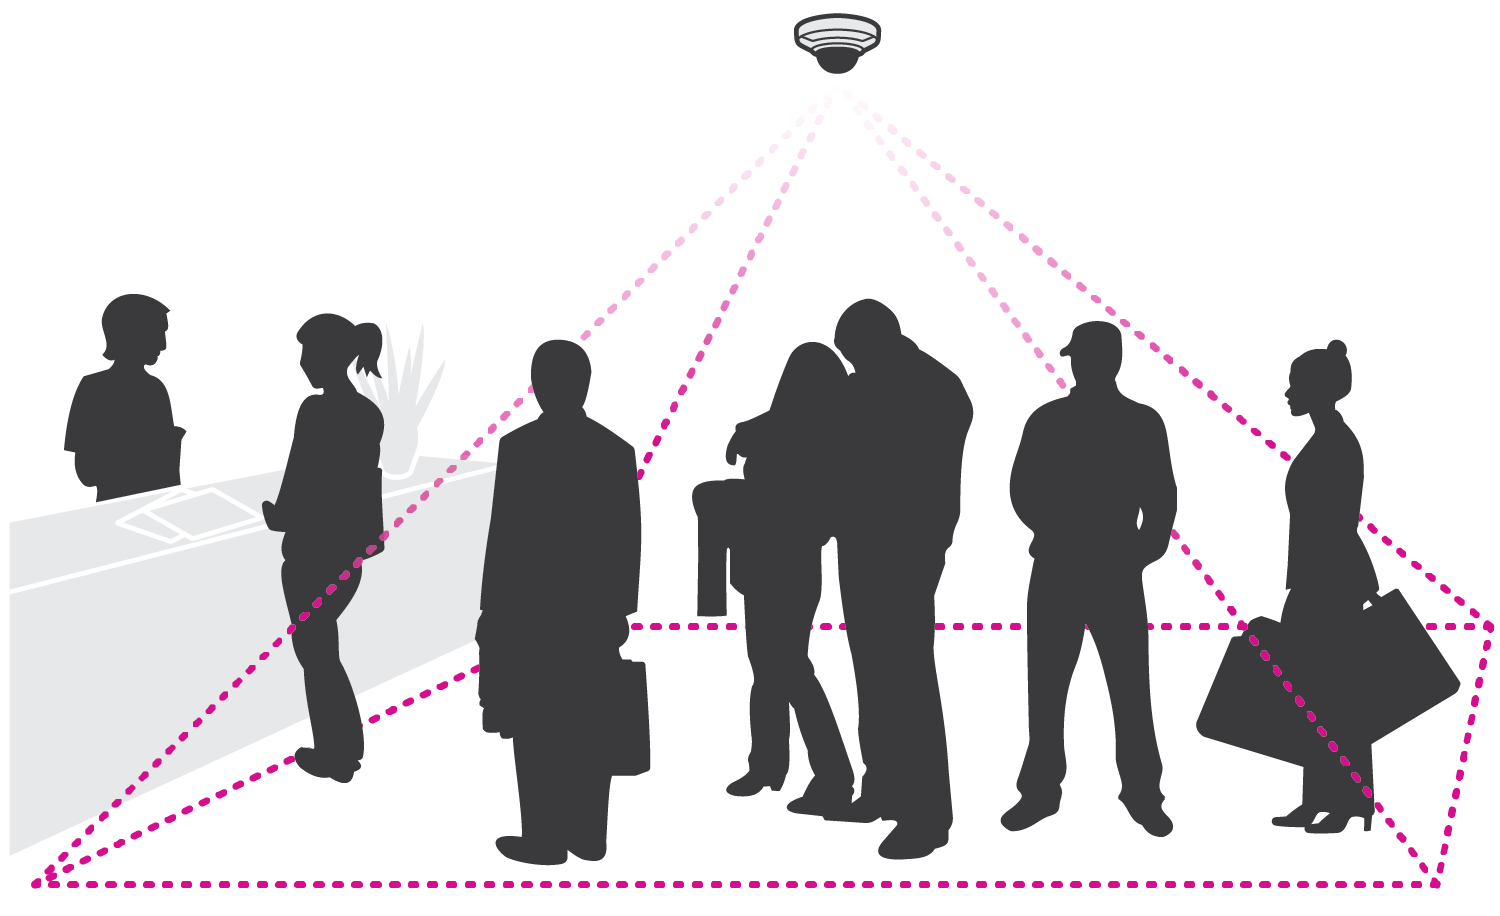
How does it work?
Together with the network camera’s event system, the application can trigger a notification when a queue is too long. The trigger can for example go off when three or more people are standing in line for more than 10 seconds. The trigger then activates an event in the camera that in turn sends an email or triggers an audio output.
One application can handle up to three queue lines simultaneously and trigger alarms if the queue becomes too long. The capacity depends on the installation situation, the camera height, and the view of the scene.
Mount the camera
For the AXIS Queue Monitor to work as expected, the camera should be installed at a high position with a good overview of the scene. A slight angle is okay as long as the object measured is about the same size in every position in the live view.
Find the device on the network
For more information about how to find and assign IP addresses, go to How to assign an IP address and access your device.
Access the device
Open a browser and enter the IP address or host name of the Axis device.
If you do not know the IP address, use AXIS IP Utility or AXIS Device Manager to find the device on the network.
Enter the username and password. If you access the device for the first time, you must set the root password. See Set a new password for the root account.
The live view page opens in your browser.
Secure passwords
Use HTTPS (which is enabled by default) to set your password or other sensitive configurations over the network. HTTPS enables secure and encrypted network connections, thereby protecting sensitive data, such as passwords.
The device password is the primary protection for your data and services. Axis devices do not impose a password policy as they may be used in various types of installations.
To protect your data we strongly recommend that you:
Use a password with at least 8 characters, preferably created by a password generator.
Don’t expose the password.
Change the password at a recurring interval, at least once a year.
Set a new password for the root account
The default administrator username is root. If the password for root is lost, reset the device to factory default settings. See
Type a password. Follow the instructions about secure passwords. See Secure passwords.
Retype the password to confirm the spelling.
Click Create login. The password has now been configured.
Install the application on the camera
- The license is only valid for one camera. You can’t activate the license on another camera without a new registration key.
- To install applications on the camera you need administrator rights.
Install the camera on your network..
Go to the camera’s web interface in your browser, see the user manual for the camera.
Go to Apps.
Upload the application file (.eap) to the camera.
Activate the license. If you’re online, enter the license code. The application automatically activates the license.
How to activate the license when you’re offline
- To activate the license when you’re offline, you need a license key. If you don’t have a license key on the computer, do the following:
Go to License key registration. You need the license code and the Axis device serial number.
Save the license key file on the computer and select the file when the application asks for it.
Access the application settings
In the camera’s web interface, go to Apps, start the application and click Open.
Additional settings
Set the date and time
The date and time settings are important for your camera to keep the correct time for a longer period of time, and for the statistics to be attributed to the correct time. You set the date and time in the camera’s web interface.
In the camera’s web interface, go to System > Date and time.
For more information about date and time settings, click
 .
.
Create a user account
You can create user accounts with different privileges, so that unauthorized staff can view statistics but not change any settings of the counter.
You create user accounts in the camera’s web interface.
In the camera’s web interface, go to System > Users.
For more information about user accounts, click
 .
.
How to set up queue areas
Go to the webpage for AXIS Queue Monitor.
Go to Settings > Queue areas.
To facilitate the drawing you can enable a grid by clicking in the image.
Select the Empty regions 1 and draw the first queue area.
Hold the shift key down when drawing your region to get a larger brush
Continue with Empty regions 2 and 3 if you want more than one queue area.
Click on Live calibration to configure the number of people that fits in the queue area, i.e. your definition of a queue situation.
About level of intensity
There are three different levels of intensity in a queue area: Low, Mid, and High. These categories are used in the statistical charts to show how long a queue has had low, mid, or high intensity.
Low: No queue
Mid: 1 person
High: 4 people
Max: The maximum number of people that can fit in the queue area at the same time, approximately 6 in this example.
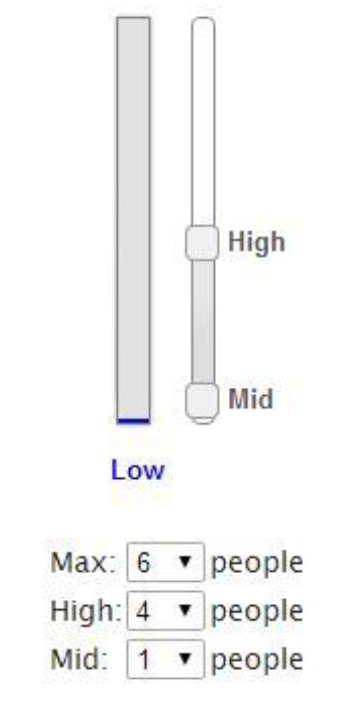
How to set the level of intensity
To make the setup and fine-tuning of the queue area easier, we recommend placing people under the camera to form an actual queue.
Start by defining how many people represent Mid and High.
Set the Max number of people that fits in the queue area.
Adjust the slider to fine-tune the representation for Low, Mid, and High queue.
Click Submit.
Go to live view to verify the settings.
How to trigger an event
Go to Settings > Triggers.
Select Enable.
Select the amount of time before the trigger should go off.
Select the queue area.
Select how many people should be in the queue for the trigger to go off.
Click + to add more triggers.
Click Submit.
Go to the camera’s webpage to access the event system.
In the event setup, use the trigger Application > QueueEvent.
Follow the built-in instructions to set up an event.
Set up a schedule
To avoid unwanted detection during the night or during holidays, we recommend that you set up a schedule.
Go to Settings > Counting schedule.
To adjust start and stop times, move any of the sliders. To set individual schedules for each day of the week, select Per day schedule and then move the corresponding sliders.
Turn off the application on a specific day of the week
Clear the checkbox next to the slider.
- Turn off the application during holidays
- Select the holiday dates in the calendar under Holidays.
Anonymize people
You can configure the application so that people can no longer be identified from the camera.
Anonymize soft
This feature blocks all video streams and images from the camera. The live view still shows a blurred image which means you can still see what is going on but you can't identify people.
Go to Maintenance > Anonymize.
Click Anonymize soft.
To go back to normal mode, click Reset anonymization. Only users with an administrator account can do this.
Copy the application settings to another camera
Use the copy functionality if you want to copy the application settings to, for example, other cameras in the same store with the same mounting height. Camera-specific settings, such as the application license and camera name, are not included.
To copy the application settings, go to Maintenance > Parameter backups.
Click Copy. The computer saves the file in your browser’s default folder for downloads.
Statistics
There are several ways to use the statistics from the counter:
In the application’s web interface, view real-time counting data in the built-in graphs.
View built-in graphs in day and week view from the statistics page. The data is updated in real time.
Data is available on the device for up to 90 days and updated every minute.
Download data through an open API. See VAPIX® Library.
Use AXIS Store Data Manager, a software package that acts as a central point to store and manage data collected from all devices. See Connect a camera to a folder in AXIS Store Data Manager.
Use AXIS Store Reporter, a statistical web-based solution, for managing and monitoring historical data.
Download statistics to your computer, see Download statistics.
About the different charts
Week chart
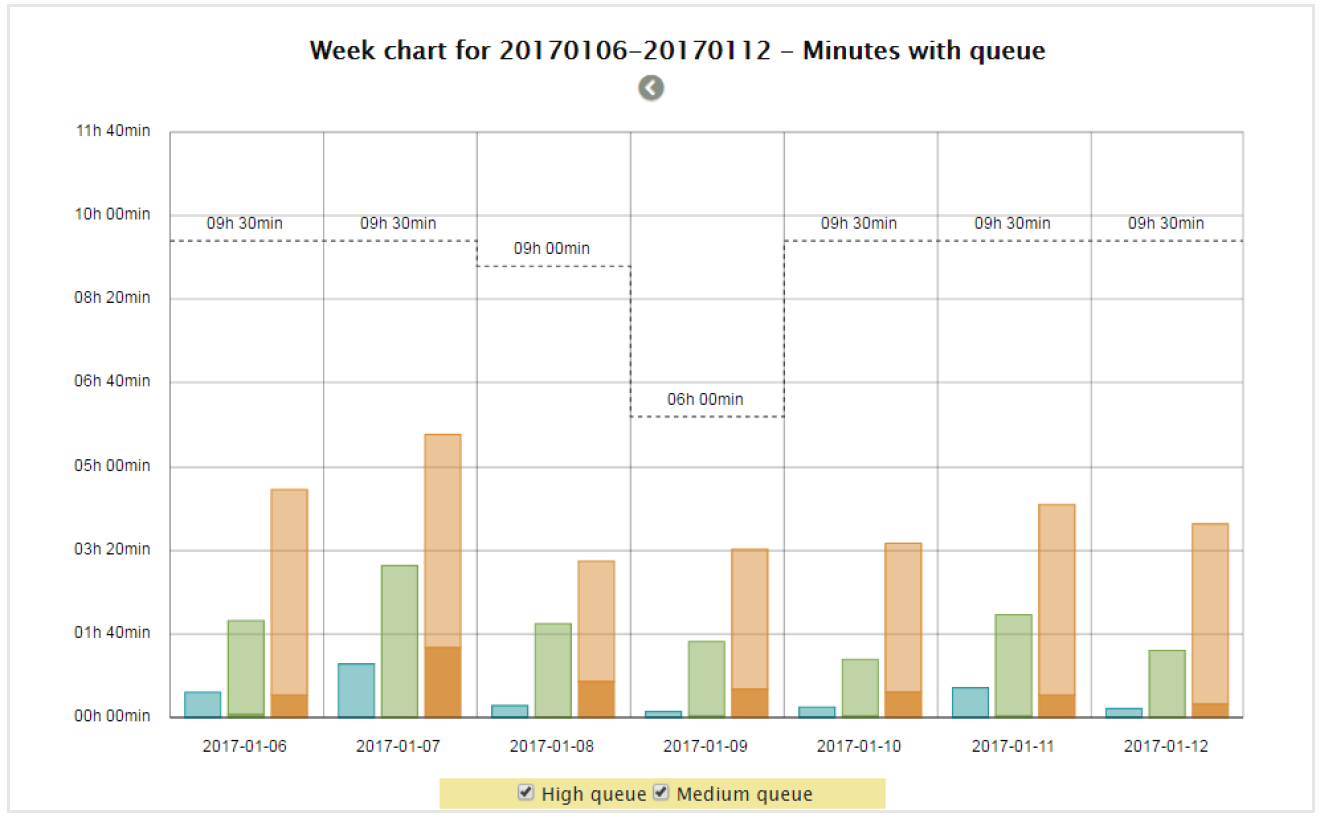
In the Statistics menu, you can find a week chart containing information about the amount of time in which there has been Medium and High queue levels during the last seven days.
In this scenario, Medium queue equals two people and High queue equals three or more people.
Queue area 1 (blue) did not have any minutes with High queue value.
Queue area 2 (green) had barely any minutes with High queue value.
Queue area number 3 (orange) had the most minutes with High queue value (three or more people).
Day chart (Minutes with queue)
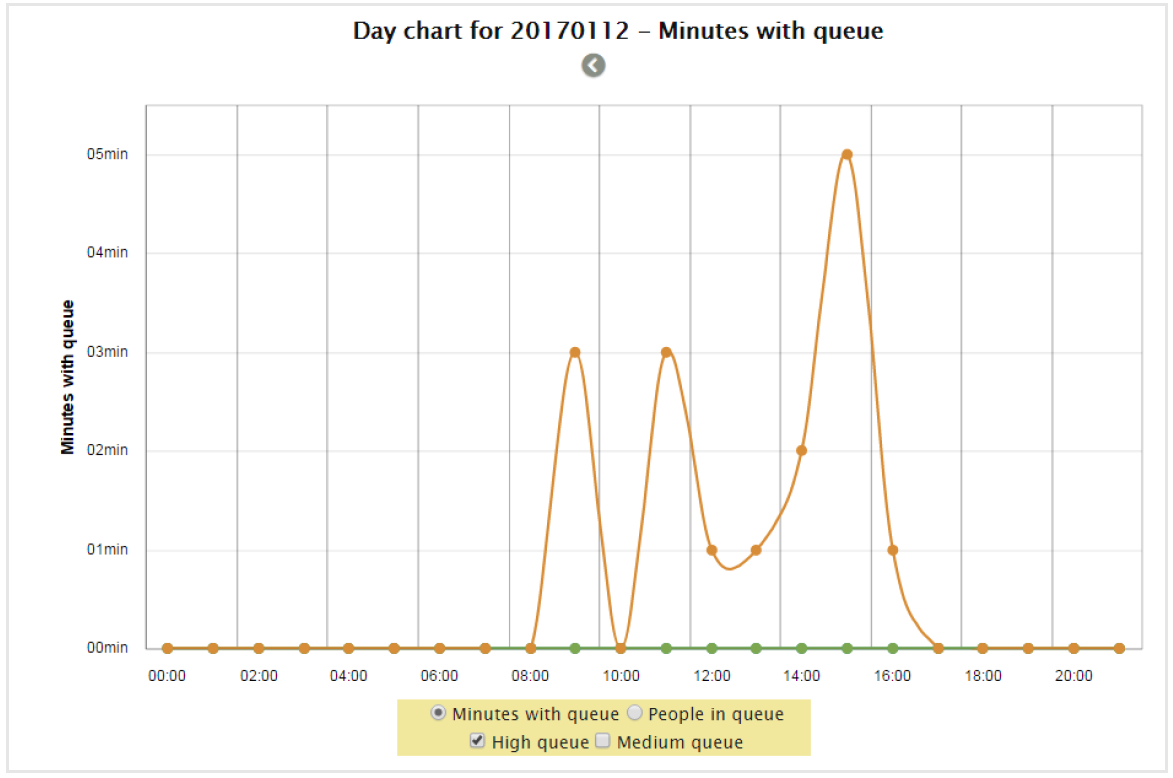
In the day chart you will get information about the minutes of Mid and High queue for each queue area. By looking at the chart we can see that queue 1 (purple line) have over 20 minutes of high queue at twelve o’clock. In this example high queue equals about three to four people.
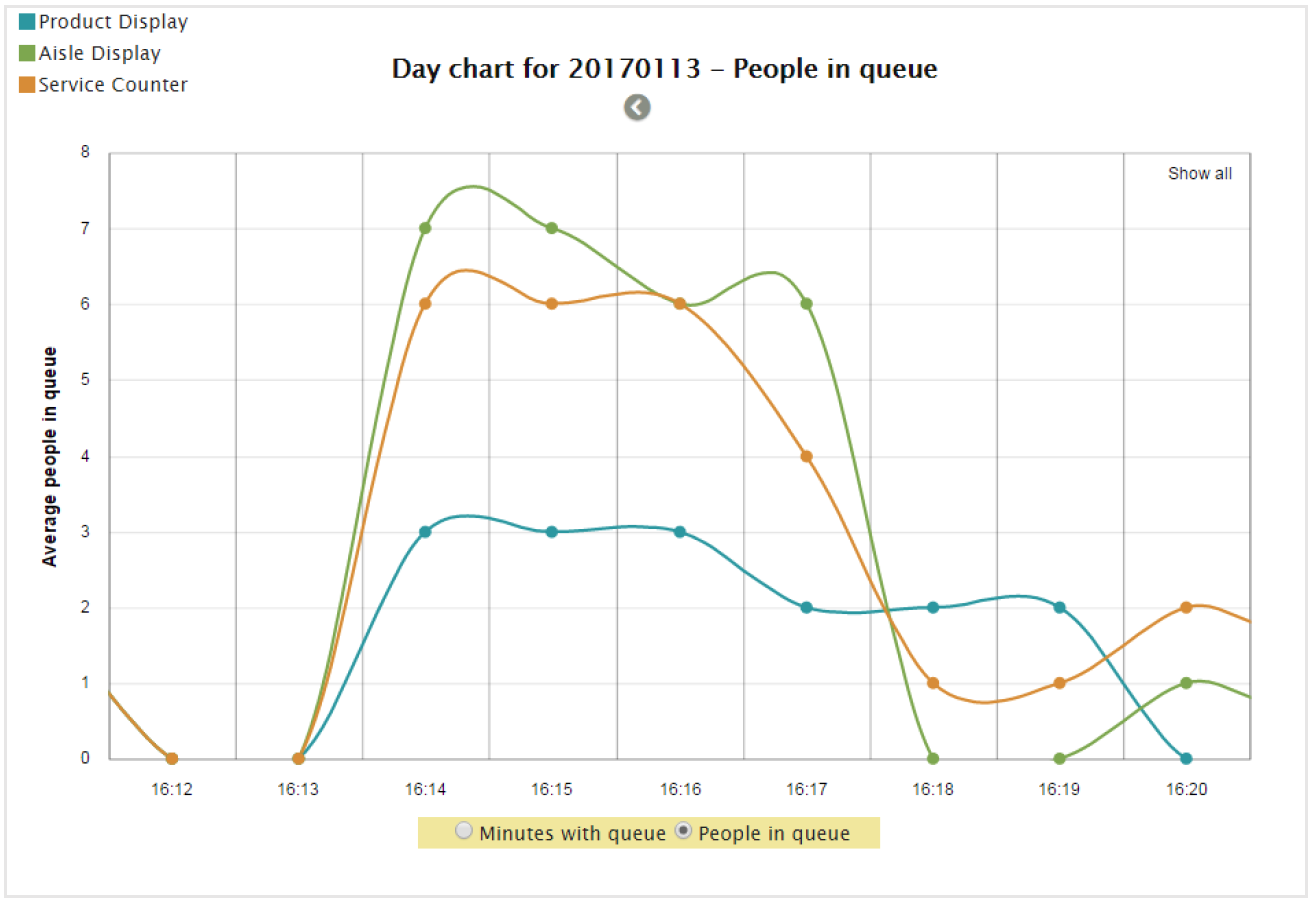
Day chart (People in queue)
You can also get information about the average of people in the queue during the day. By looking at the chart below we can see when people starts to queue and get an estimate of how many people queue during different time intervals for each queue area.
Connect a camera to a folder in AXIS Store Data Manager
To perform this task, the application must be installed on the camera.
In AXIS Store Data Manager, go to Sources and get the Folder connection identifier and the Folder connection password for the folder you want to connect to.
In the camera’s web interface, go to Settings > Apps and open the application’s web interface.
In the application’s web interface, go to Settings > Reporting.
To enable pushing data to a server, select Enabled.
Enter the web address for AXIS Store Data Manager, for example
http://[subdomain].asdm.axis.com/datamanagerwhere[subdomain]is replaced by a unique name.Enter the Folder connection identifier and Folder connection password.
To test the connection, click Run test.
Click Submit.
Download statistics
You can download the data directly from the camera in .csv format.
Go to Statistics > Download statistics.
Select between Minutes with queue or People in queue.
Minutes with queue data is stored for 90 days in the camera and the shortest time interval is15 minutes.
People in queue data is stored for 90 days in time intervals of 15 minutes or 30 days in time intervals of one minute.
Select the date in the calendar. The browser saves the file in the default download folder.
- If you want to download all available data for the 90- or 30-day period, click Download all next to the file format.
Troubleshooting
| Issue | Action |
| The software doesn’t upload to AXIS Store Data Manager. | The most common reason is network communication problems. Run the connection test under Settings > Reporting to get information about the root cause for the problem. |
Restart the application
If the counting is inaccurate or the web interface unusually slow, you can try restarting the running services or restart the device.
To restart the device, go to Maintenance > Restart.
Reset the application
Go to Maintenance > Reset and do one of the following:
To clear all counting data from the camera, click Clear data.
To restore all settings of the application to default, click Restore settings.
Back up the settings
To back up the application settings, go to Maintenance > Parameter backups.
Click Backup. The computer saves the file in your browser’s default folder for downloads.
Restore the settings
Go to Maintenance > Parameter backups.
Browse to select the previously saved backup file and then click Restore.
Generate a log report
If you have any trouble with your device you can generate a log report.
Go to Maintenance > Logs.
Click Generate logs.
The browser saves the file on the default download browser on the computer.
Attach the log report when submitting an issue to support.
Manage your license
Go to Maintenance > Registration.
To register a license, click on the Registration page.
If you want to remove you license from this product, click Clear registration.
If you have an updated license, click Renew license.
Common examples
Example
Request the number of people standing in queue at this moment.
Requesthttp://<servername>/local/queue/.api?live-sum-people.jsonReturn{ "serial":"ACCC8E20F09B", "name":"Service Counter", "timestamp":"20170113181132", "region1name":"Product Display", "region1people":1, "region2name":"Aisle Display", "region2people":0, "region3name":"Service Counter", "region3people":3 }See Get real time people in queue data for more information.
Example
Request historical minutes of queue data in CSV format for the 1st and the 3rd of May 2017 with a 5 hour resolution.
Requesthttp://<servername>/local/queue/.api?export-csv-minutes&date=20170501,20170503&res=5hReturnInterval start,Interval stop,Camera serial number,Name,Region1 High,Region1 Mid,Region1 Low,Region2 High,Region2 Mid,Region2 Low,Region3 High,Region3 Mid,Region3 Low 2017-05-01 00:00:00,2017-05-01 05:00:00,00XXXXXXXXXX,Camera1,0,0,300,0,0,300,0,0,300 2017-05-01 05:00:00,2017-05-01 10:00:00,00XXXXXXXXXX,Camera1,0,0,300,0,0,300,0,20,280 2017-05-01 10:00:00,2017-05-01 15:00:00,00XXXXXXXXXX,Camera1,0,0,300,0,0,300,0,174,126 2017-05-01 15:00:00,2017-05-01 20:00:00,00XXXXXXXXXX,Camera1,0,0,300,0,0,300,0,109,191 2017-05-01 20:00:00,2017-05-02 01:00:00,00XXXXXXXXXX,Camera1,0,0,300,0,0,300,0,0,300 2017-05-03 00:00:00,2017-05-03 05:00:00,00XXXXXXXXXX,Camera1,0,0,300,0,0,300,0,0,300 2017-05-03 05:00:00,2017-05-03 10:00:00,00XXXXXXXXXX,Camera1,0,34,266,0,17,283,8,67,225See Request CSV minute data for more information.
Example
Request historical people in queue data, in CSV format, for the 4th of April and the 3rd of May 2017 with a 120 minute resolution.
Requesthttp://<servername>/local/queue/.api?export-csv-people&date=20170428,20170503&res=120mReturnInterval start,Interval stop,Camera serial number,Name,People in Region1,People in Region2,People in Region3 2017-05-03 00:00:00,2017-05-03 02:00:00,00XXXXXXXXXX,Camera2,0,0,2 2017-05-03 02:00:00,2017-05-03 04:00:00,00XXXXXXXXXX,Camera2,1,1,1 2017-05-03 04:00:00,2017-05-03 06:00:00,00XXXXXXXXXX,Camera2,1,0,1 2017-05-03 06:00:00,2017-05-03 08:00:00,00XXXXXXXXXX,Camera2,1,0,2 2017-05-03 08:00:00,2017-05-03 10:00:00,00XXXXXXXXXX,Camera2,1,0,1See Request CSV people data for more information.
API specification
Get real time people in queue data
- Format:
- JSON
- Method:
- GET
http://<servername>/local/queue/.api?live-sum-people.json{
"serial":"<camera-serial>",
"name":"<counter-name>",
"timestamp":"<timestamp>",
"region1name":"<name1>",
"region1people":<people1>,
"region2name":"<name2>",
"region2people":<people2>,
"region3name":"<name3>",
"region3people":<people3>
}| Value | Description |
|---|---|
| <camera-serial> | camera serial number |
| <counter-name> | name of the counter |
| <timestamp> | time in the camera in the format YYYYMMDDhhmmss |
| <region1name> | name of region 1 |
| <region1people> | number of people standing in region 1 |
Request CSV minute data
- Format:
- CSV
- Method:
- GET
http://<servername>/local/queue/.api?export-csv-minutes[&date=<date>][&res=<res>]| Parameter | Description |
|---|---|
| <date> | a date of the form YYYYMMDD |
a date interval of the form YYYYMMDD-YYYYMMDD | |
comma separated dates of the form YYYYMMDD,[..],YYYYMMDD | |
all (default) for all available data | |
| <res> | 15m (default) for data in 15 minute bins |
1h for data in 1 hour bins | |
24h for data in 1 day bins |
Return
This script returns data in plain text, comma-separated values. The first line is a comma-separated header describing each column. Each integer value states the number of minutes for which there has been a certain amount of queue (High/Mid/Low) for a certain region.
Request CSV people data
- Format:
- CSV
- Method:
- GET
http://<servername>/local/queue/.api?export-csv-people[&date=<date>][&res=<res>]| Parameter | Description |
|---|---|
| <date> | a date of the form YYYYMMDD |
a date interval of the form YYYYMMDD-YYYYMMDD | |
comma separated dates of the form YYYYMMDD,[..],YYYYMMDD | |
all (default) for all available data | |
| <res> | 1m for data in 1 minute bins |
15m (default) for data in 15 minute bins | |
1h for data in 1 hour bins | |
24h for data in 1 day bins |
Return
This script returns data in plain text, comma-separated values. The first line is a comma separated header describing each column. Each integer value states the average number of people within a certain region of interest.
Clear local queue data
- Format:
- text/plain
- Method:
- GET
http://<servername>/local/queue/.apioperator?clear-dataOKList application parameters
- Format:
- JSON
- Method:
- GET
http://<servername>/local/queue/.api?params.jsonReturn
A JSON object of all the application related parameters.
Set application related parameters
- Format:
- text
- Method:
- POST
The post format has a format where pairs and values need to be specified, best described by an example: &p1=Counter.Enabled&v1=1&p2=WebReportUpload.Enabled&v2=1
http://<servername>/local/queue/.apioperator?setparamsOKShow the system log
- Format:
- text/plain
- Method:
- GET
http://<servername>/local/queue/.apioperator?show-logsReturn
Displays the system logs.
Generate a log archive
- Format:
- tar.gz
- Method:
- GET
http://<servername>/local/queue/.apioperator?generate-logsReturn
A log archive